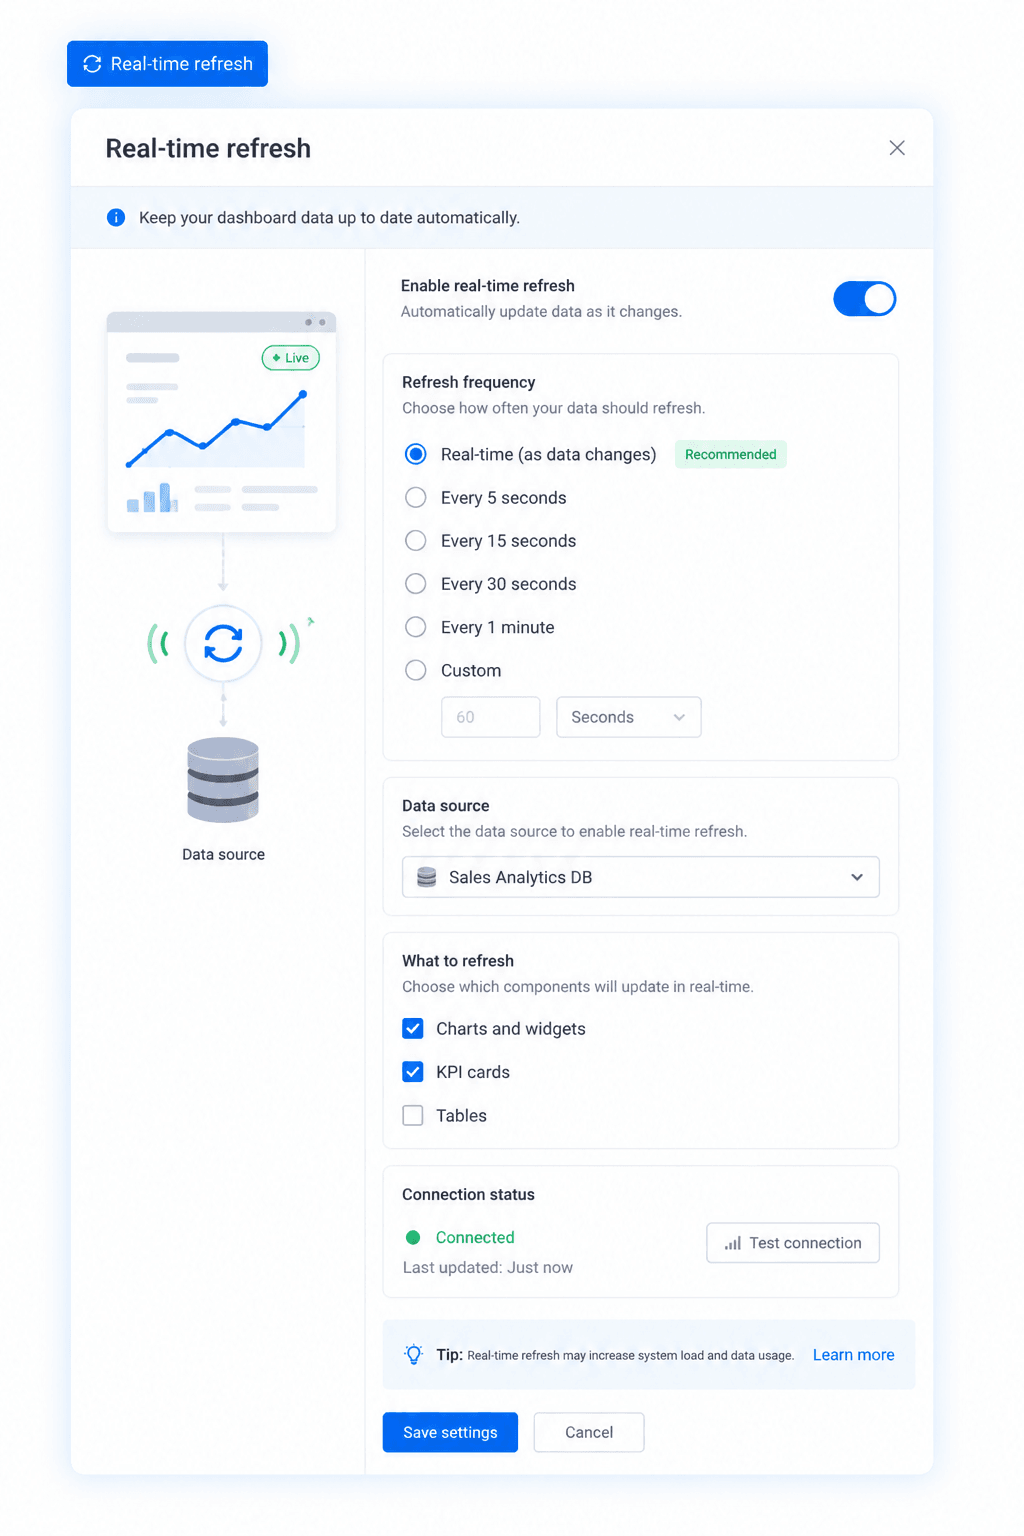
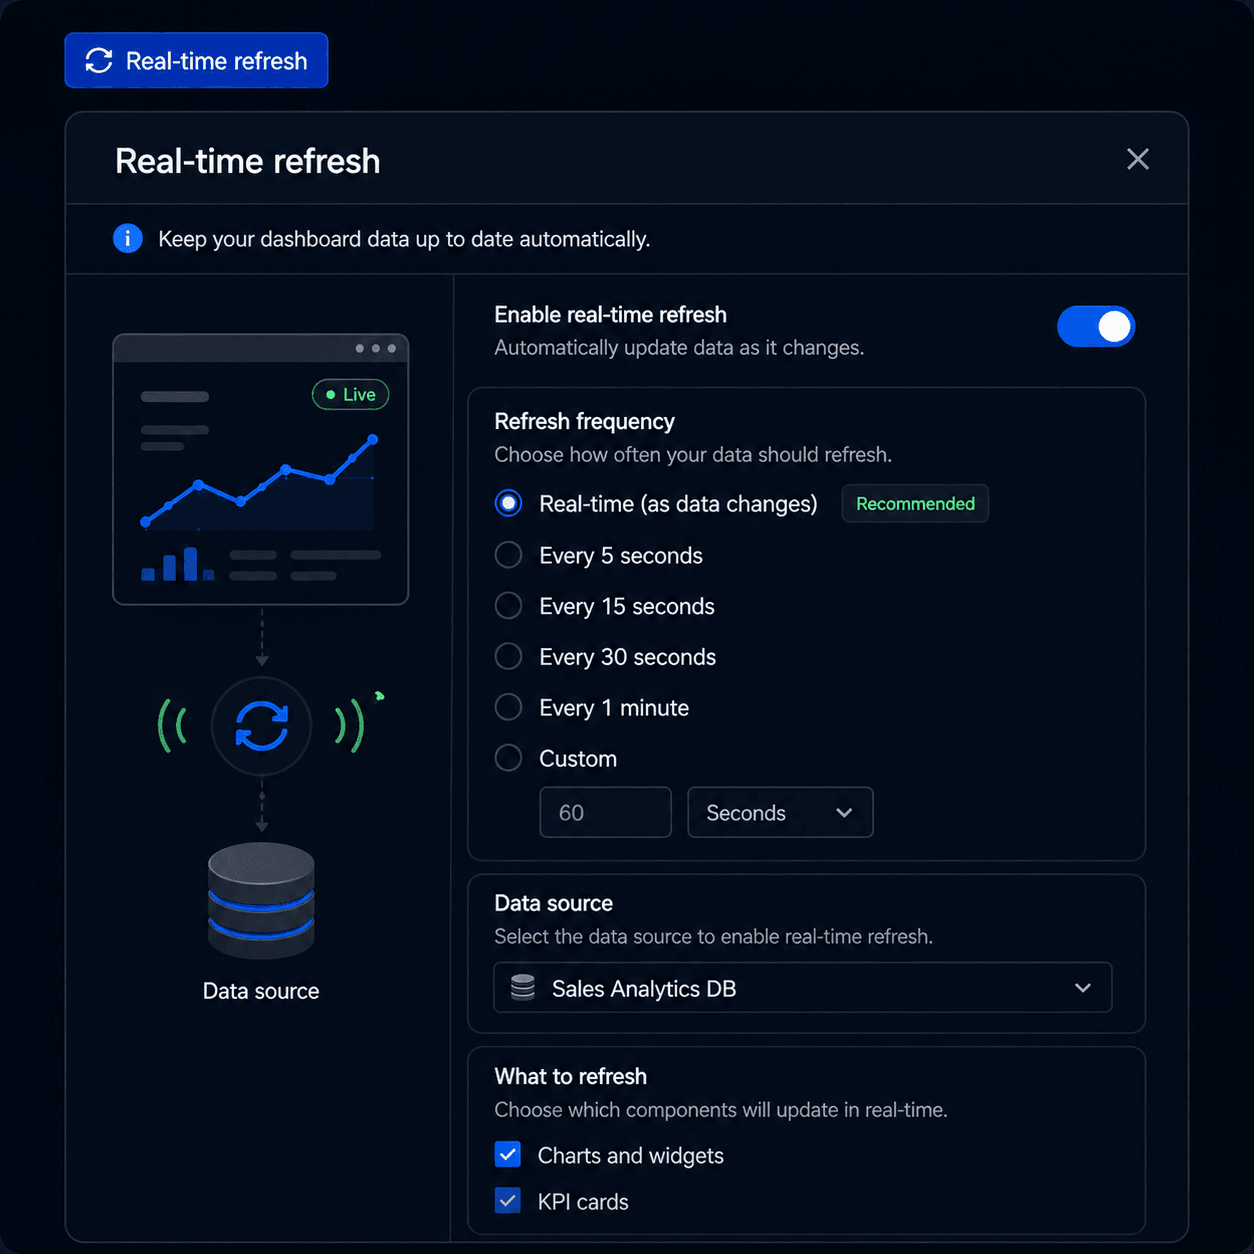
Real-time refresh
Off, 30s, 1m, 5m, 15m, 30m, or 1hr — set the refresh interval per dashboard, not per session.
9 chart types, drag-and-drop dashboards, real-time refresh, and scheduled email delivery — no analyst, no Friday export.
Free for 14 days · No credit card required


Six capabilities that replace the spreadsheet, the analyst, and the Friday export.
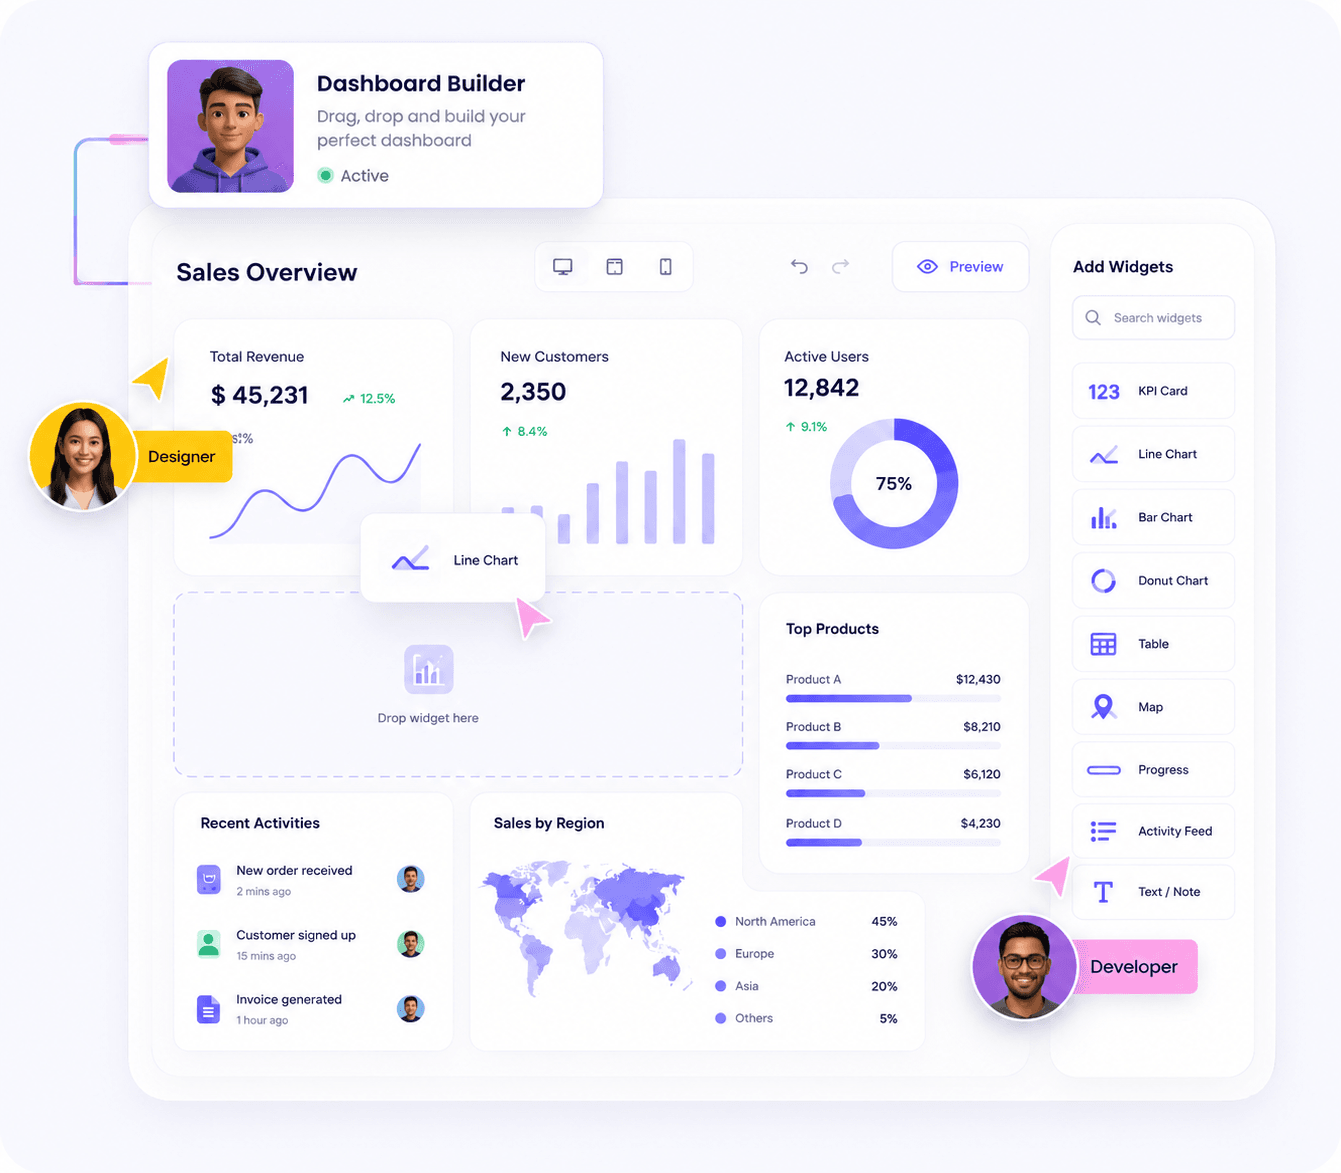
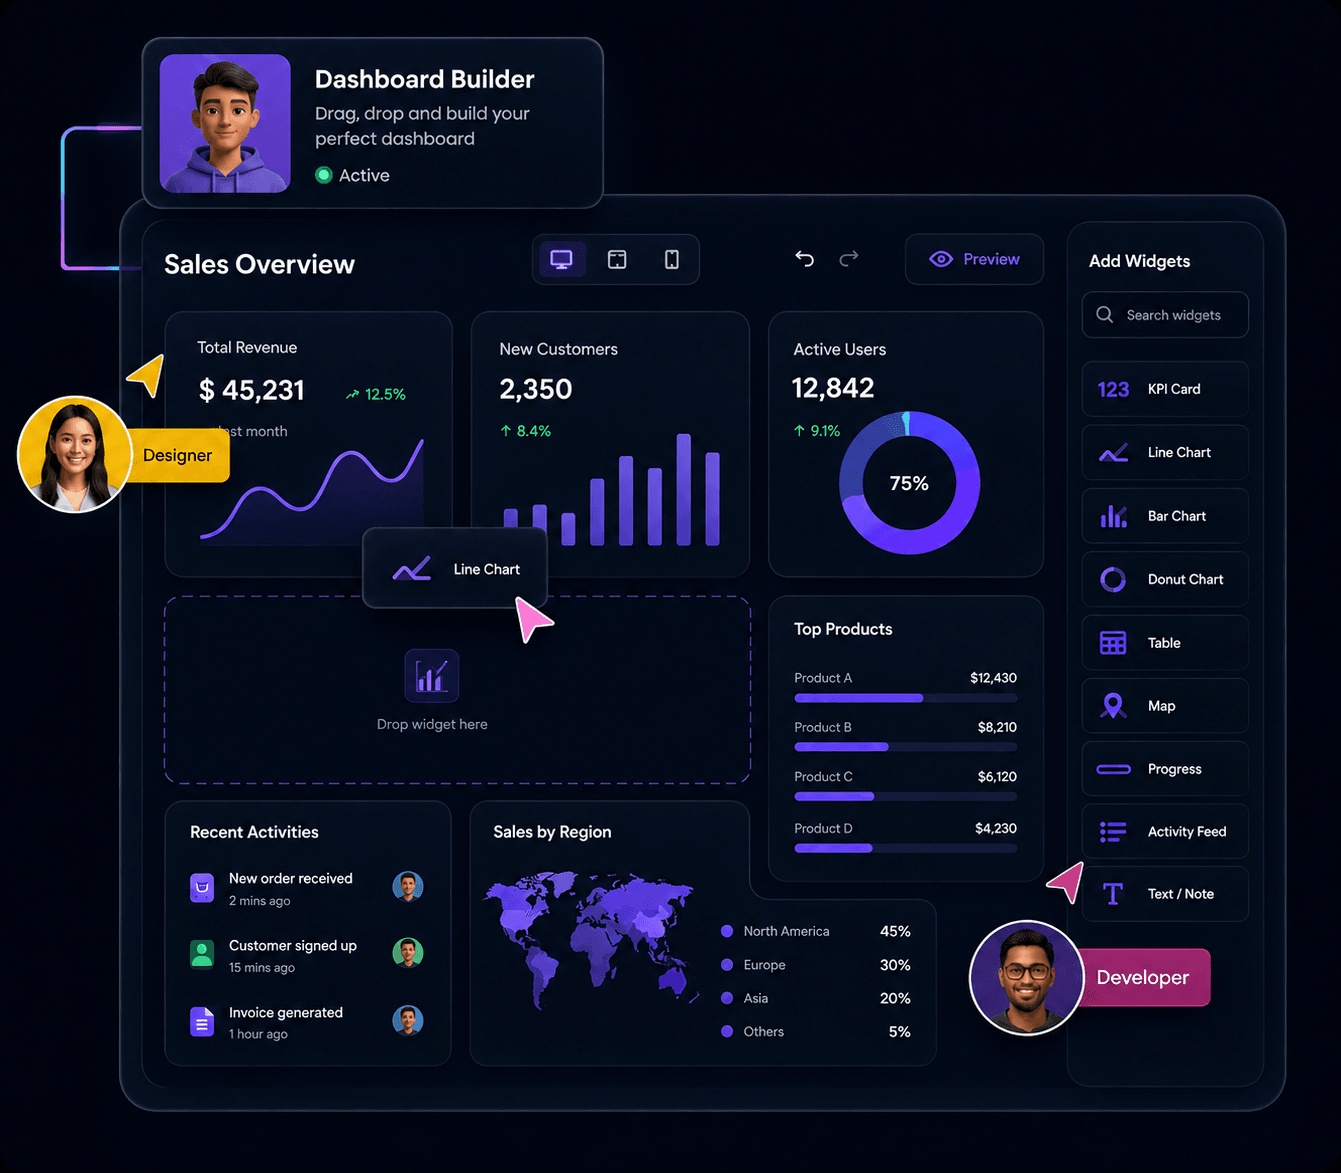
Drag-and-drop tiles with resizable widgets. Build your own layout or start from a predefined caseload dashboard.
Build a dashboard from your live case data in minutes — no SQL, no analyst, no waiting.
Adjust date ranges and filters per widget without rebuilding the dashboard.
Keep teams updated with live case data — refresh intervals from 30s to 1hr.
Manage dashboard access by role. Grant view or edit access per user.
Drag-and-drop tiles with resizable widgets. Build your own layout or start from a predefined caseload dashboard.
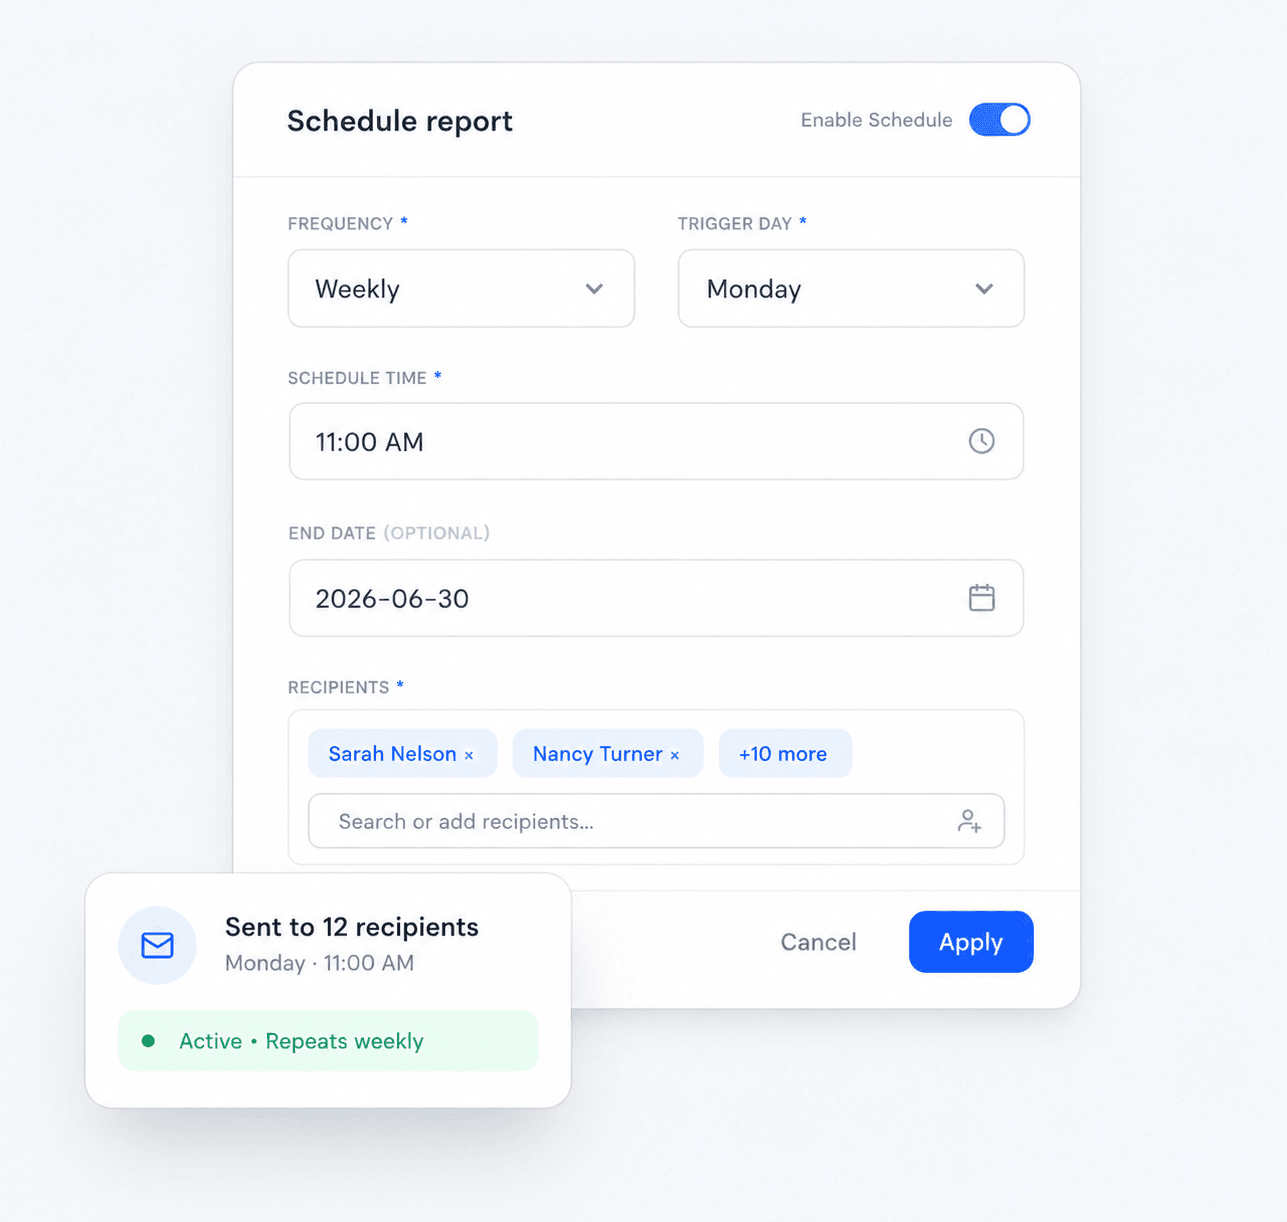
Schedule any report to email automatically — weekly on Monday at 11 AM, to every director on the list.
Done once, runs forever.
Daily, weekly (any day), or monthly — with a configurable time.
Add team members by name — no email addresses to type manually.
Time-box delivery for audits or quarterly reviews.
Download as Excel, CSV, PDF, or PNG at any time.
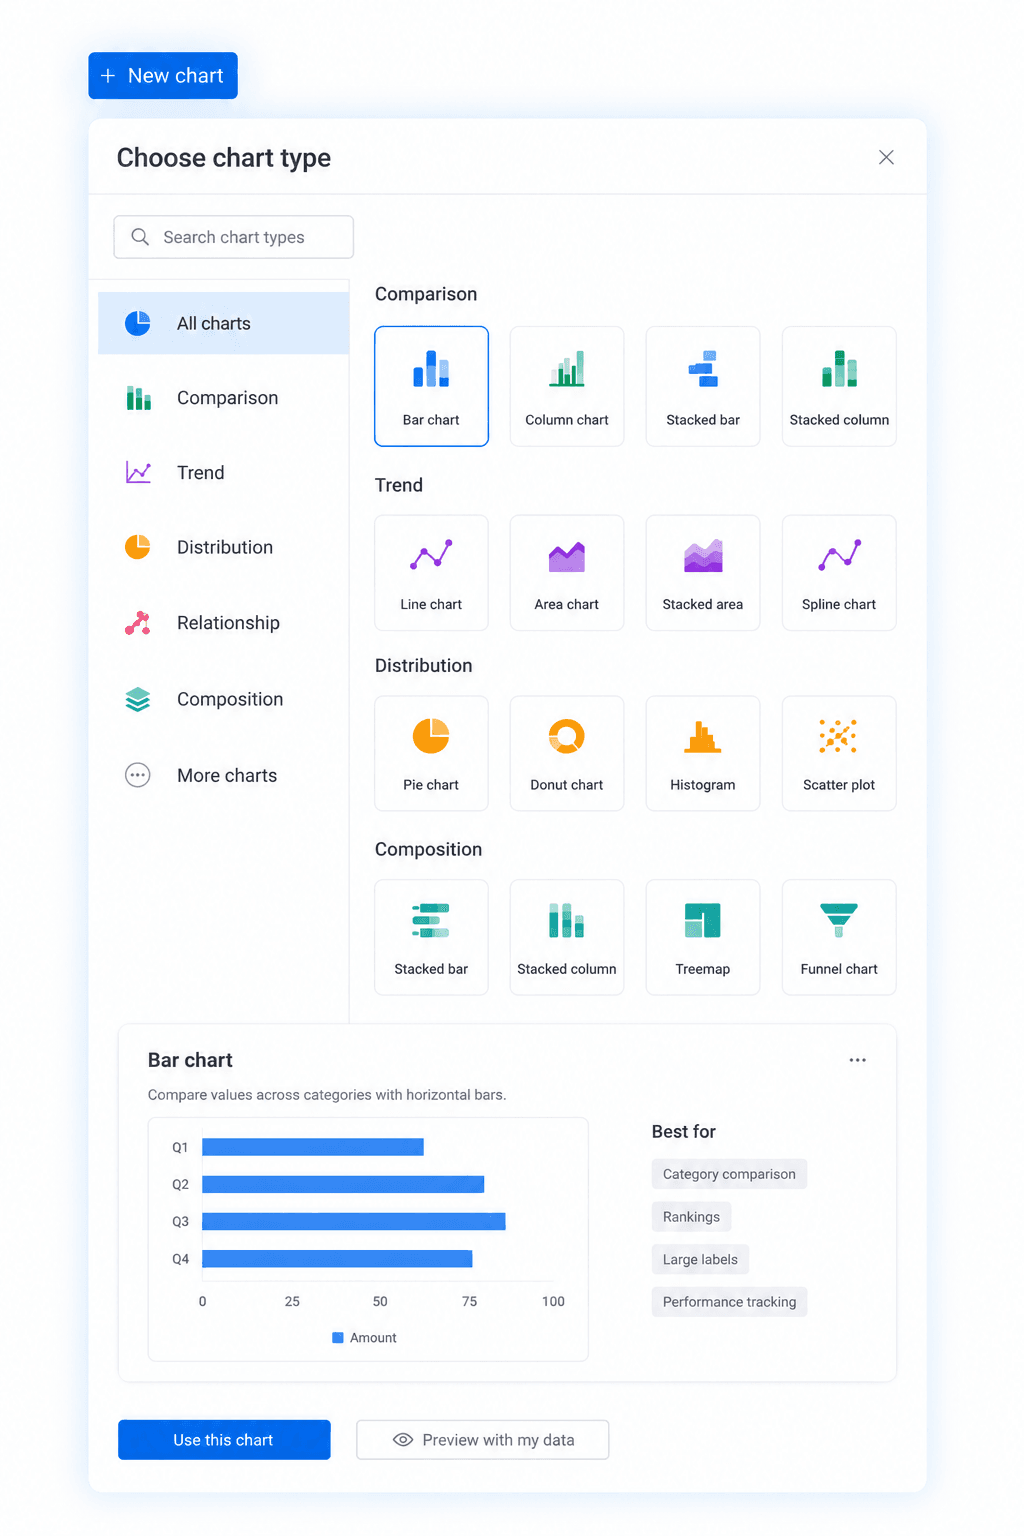
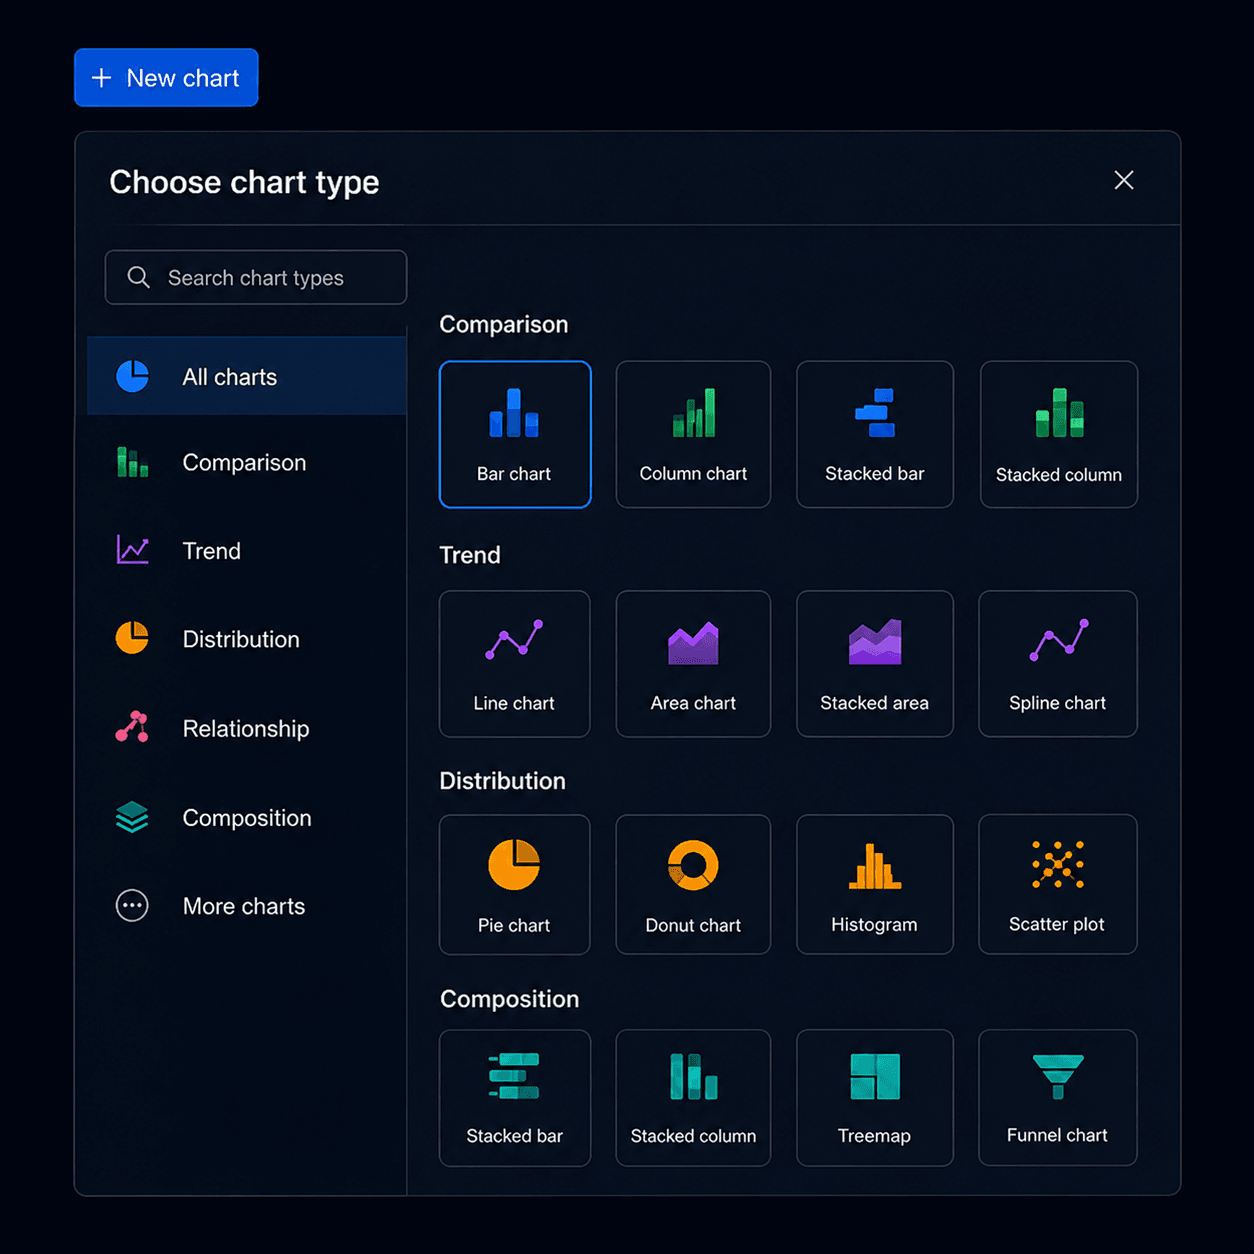
Pick the chart that matches how your team thinks about the data.
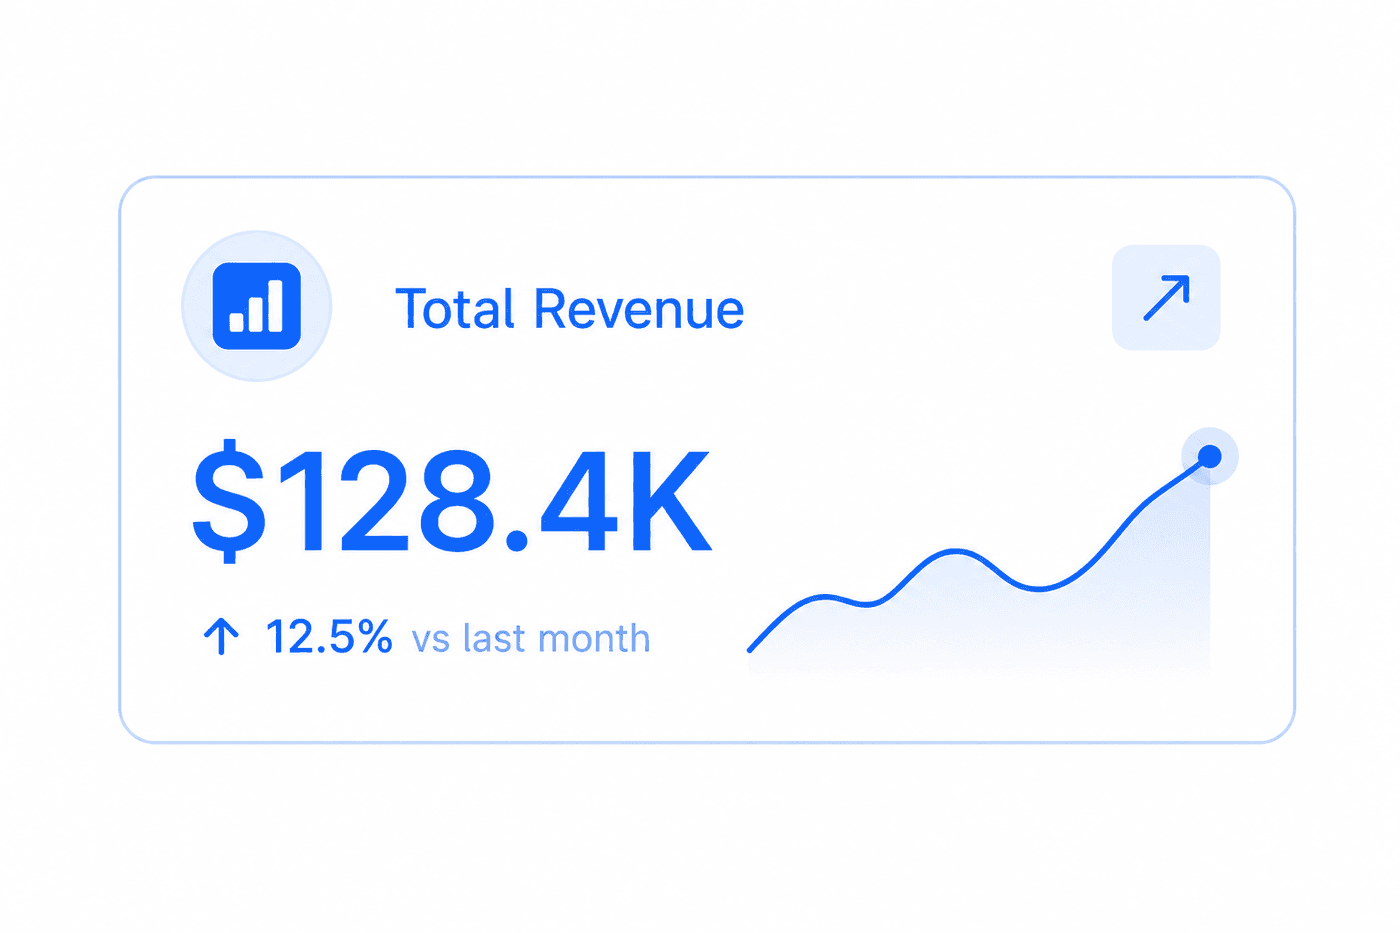
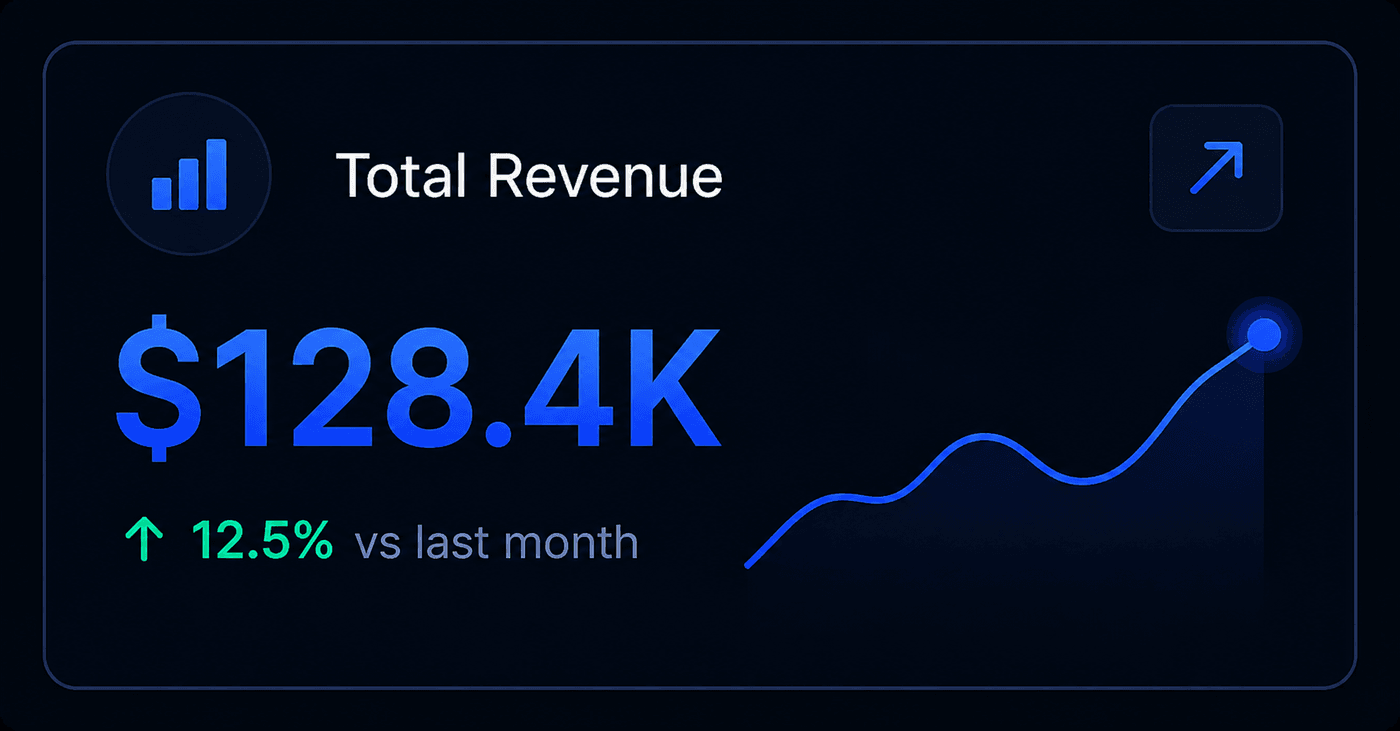
Single metric with label and optional goal.


Stage conversion and pipeline drop-off.
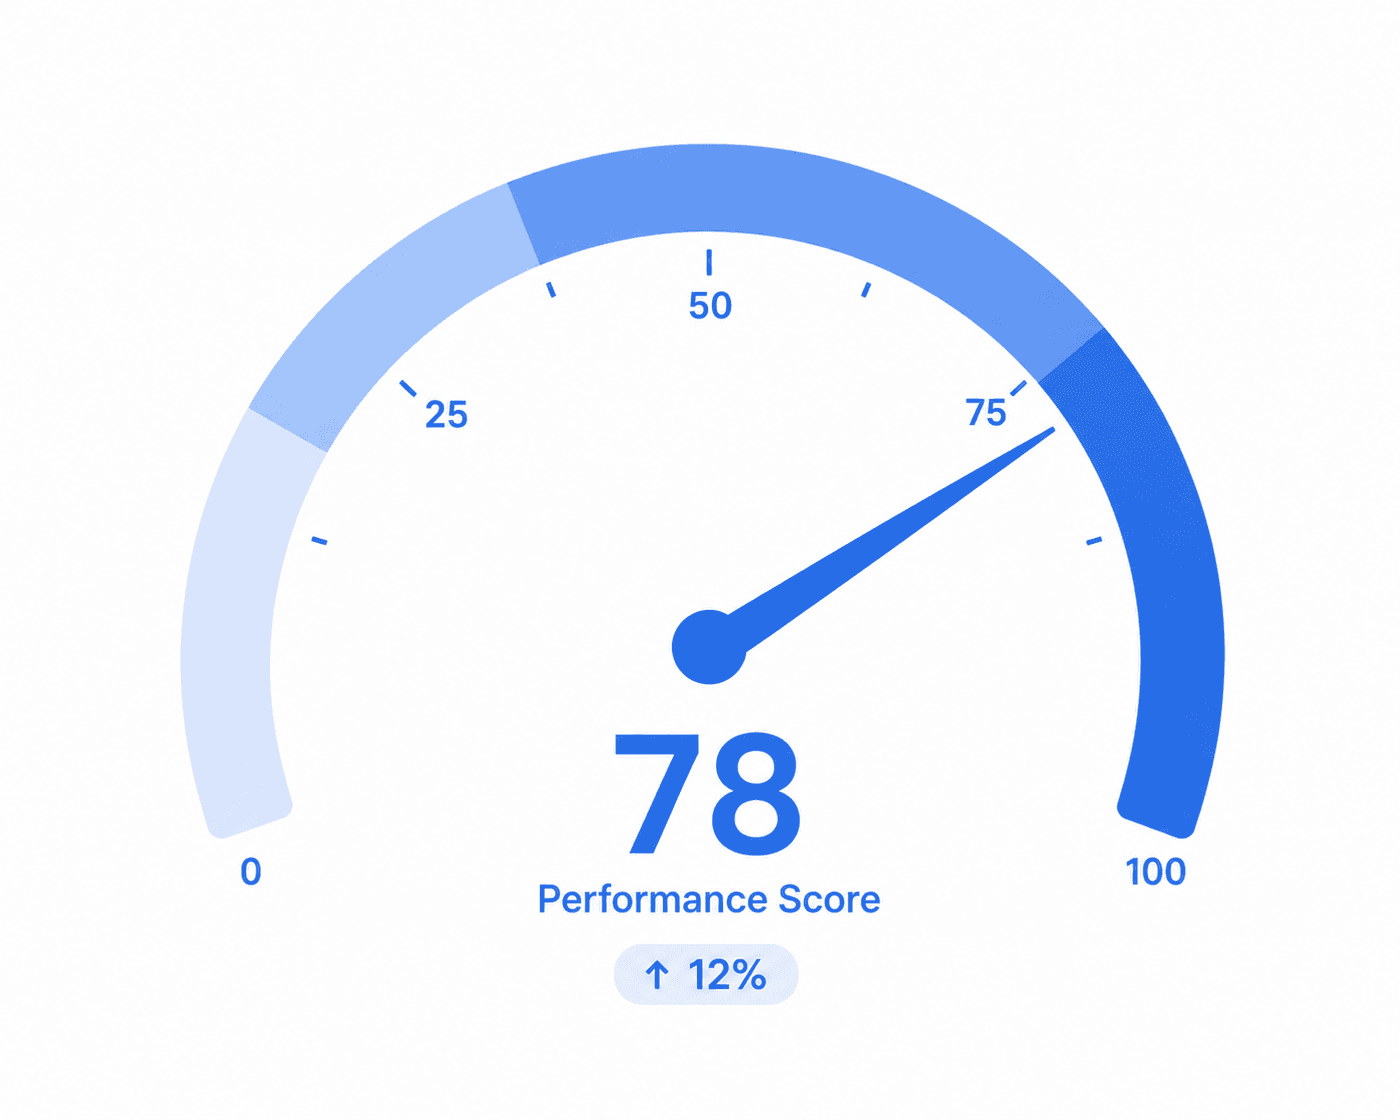
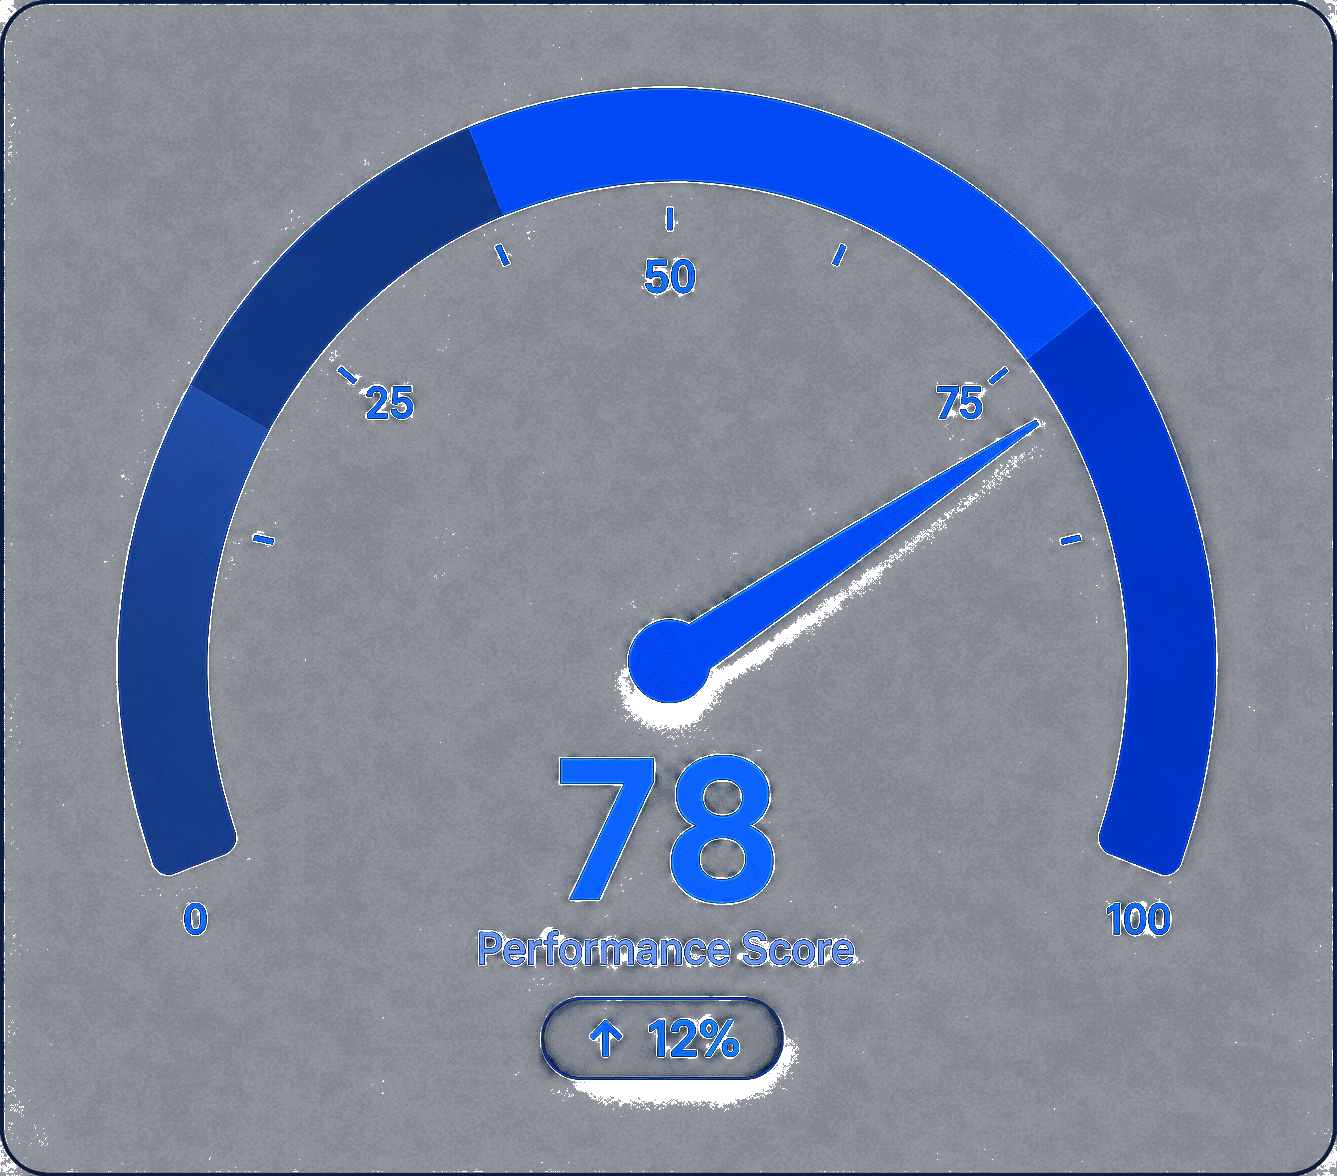
Semicircle showing current vs. target.
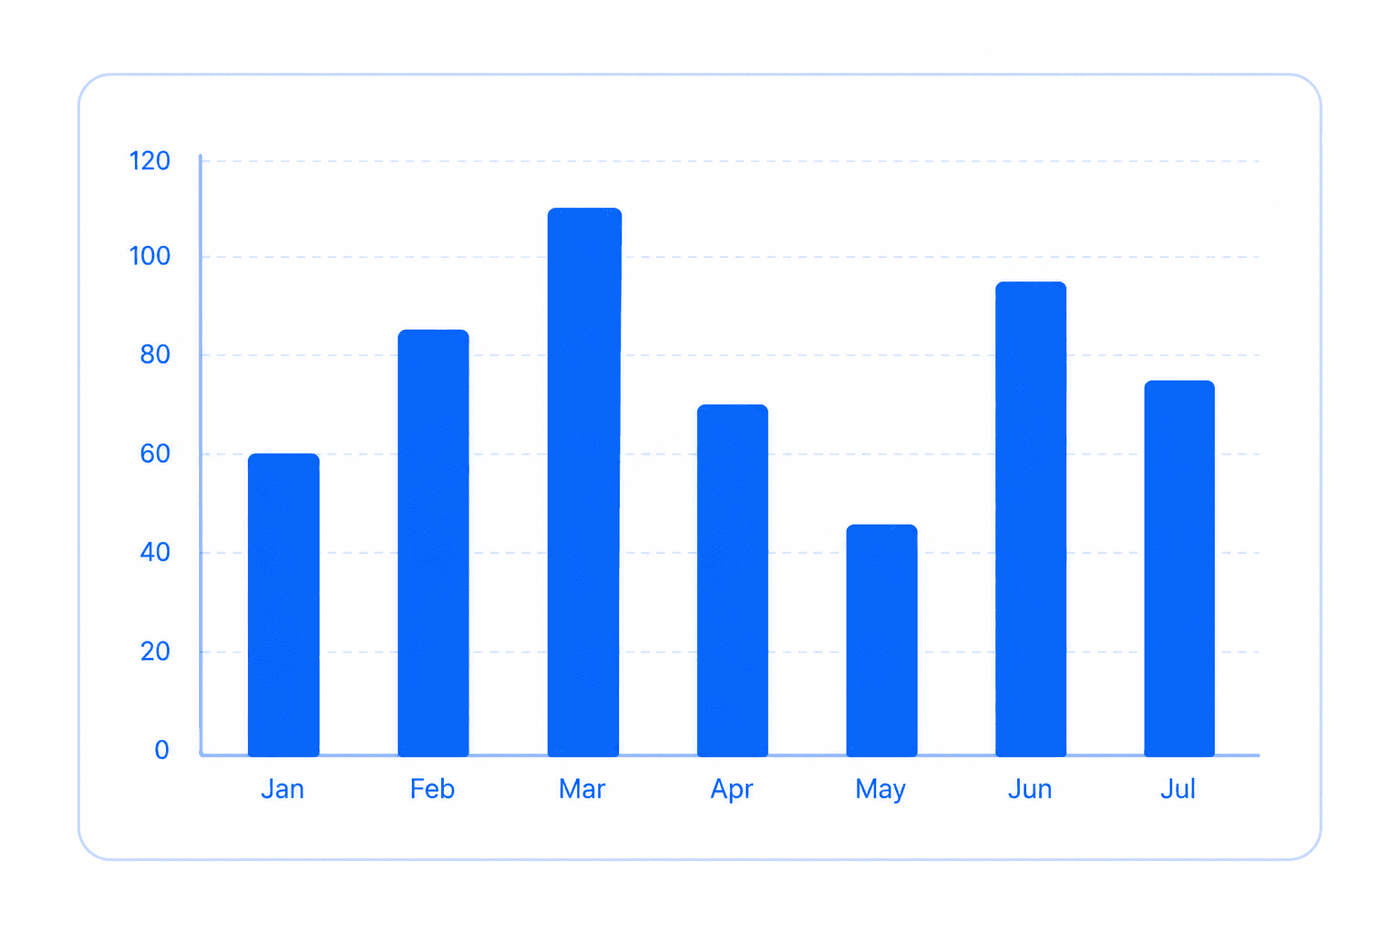
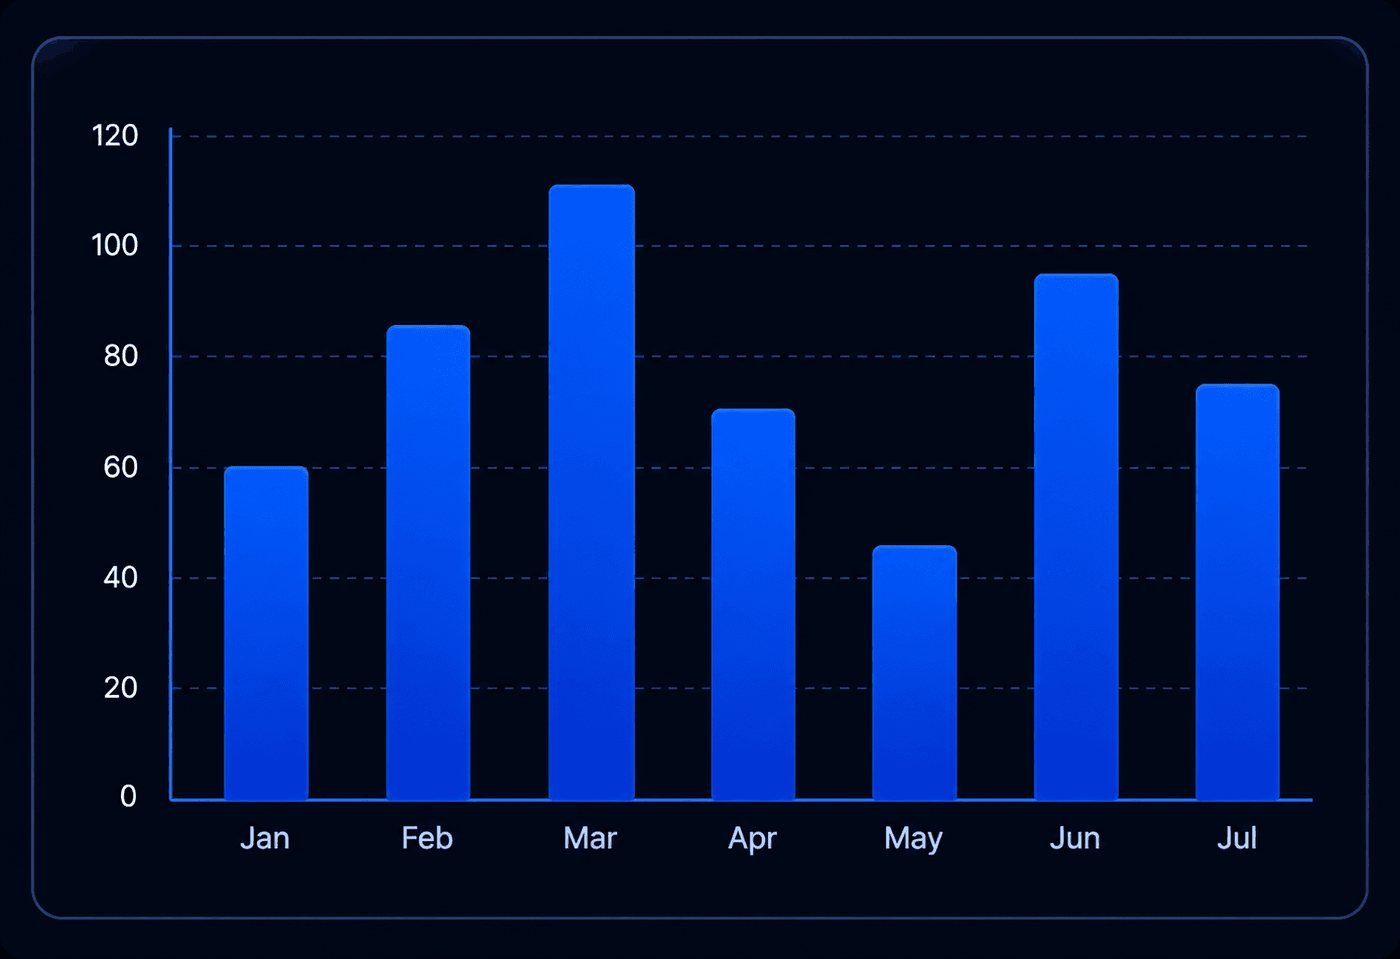
Compare values across categories.
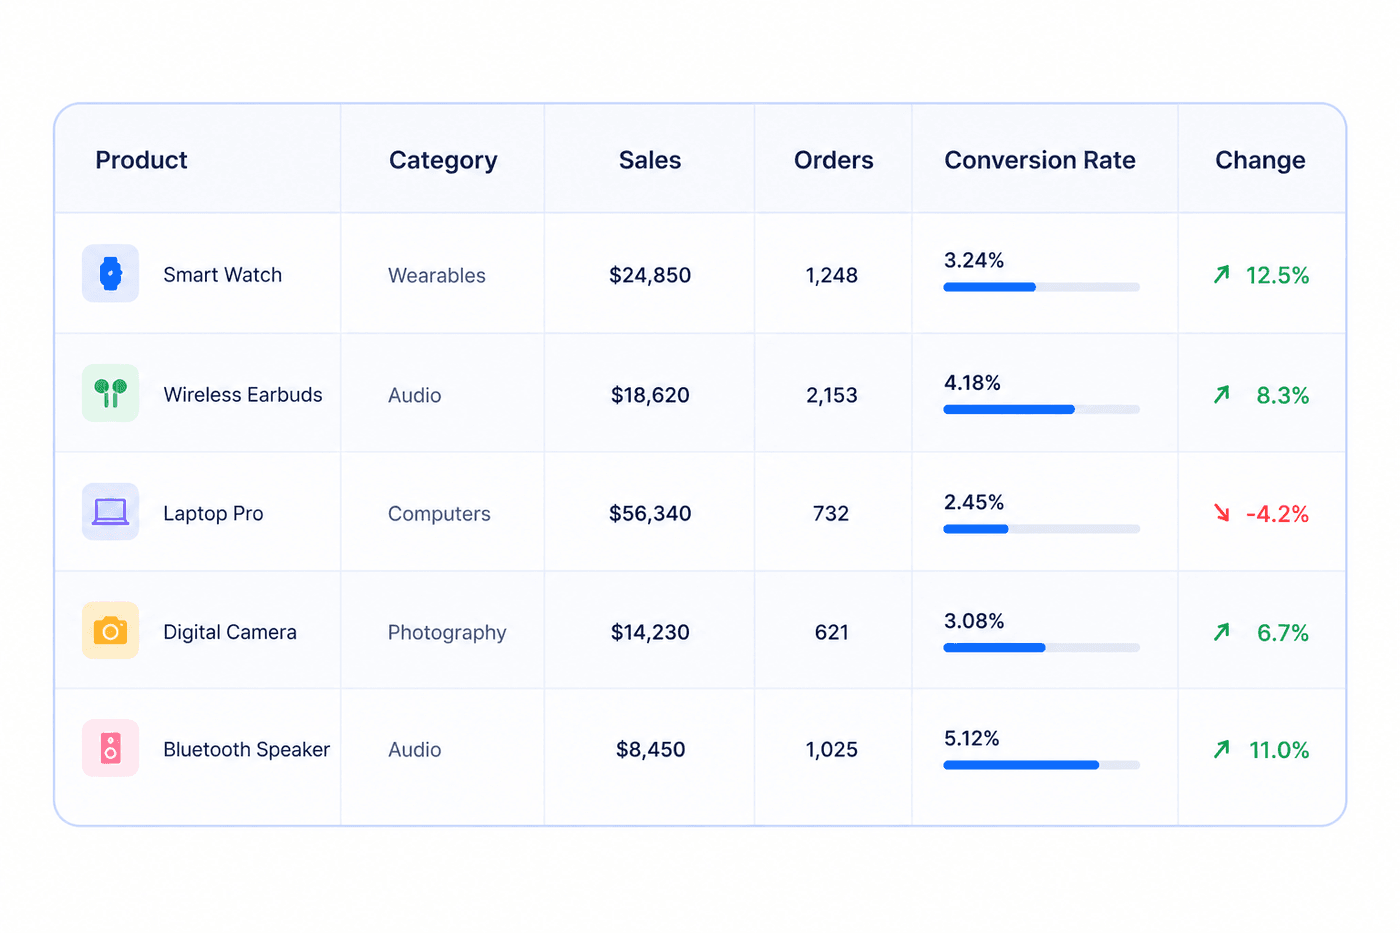
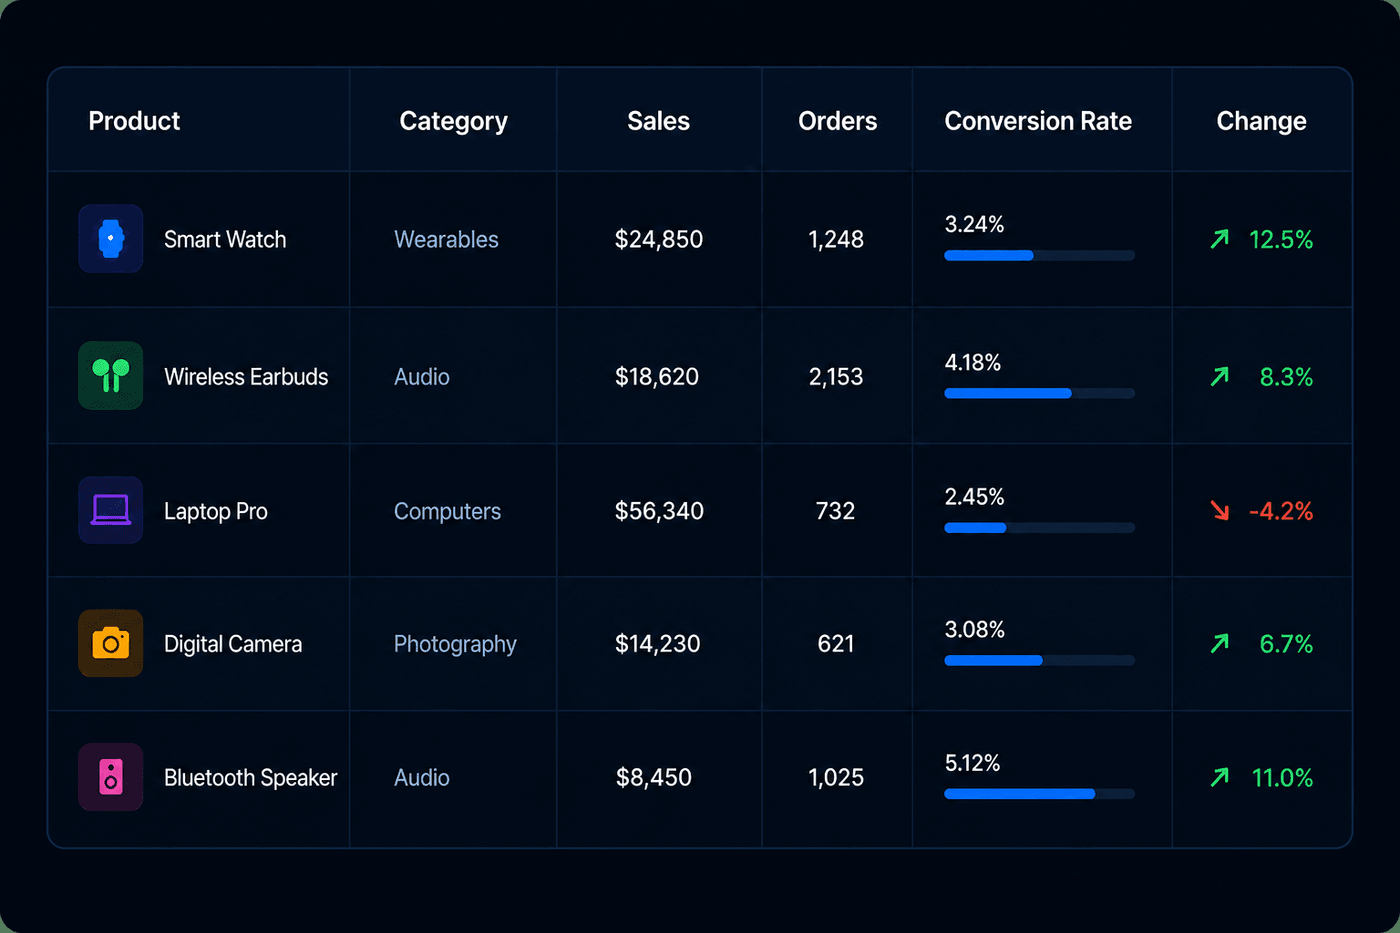
Sortable columns with row-level detail.
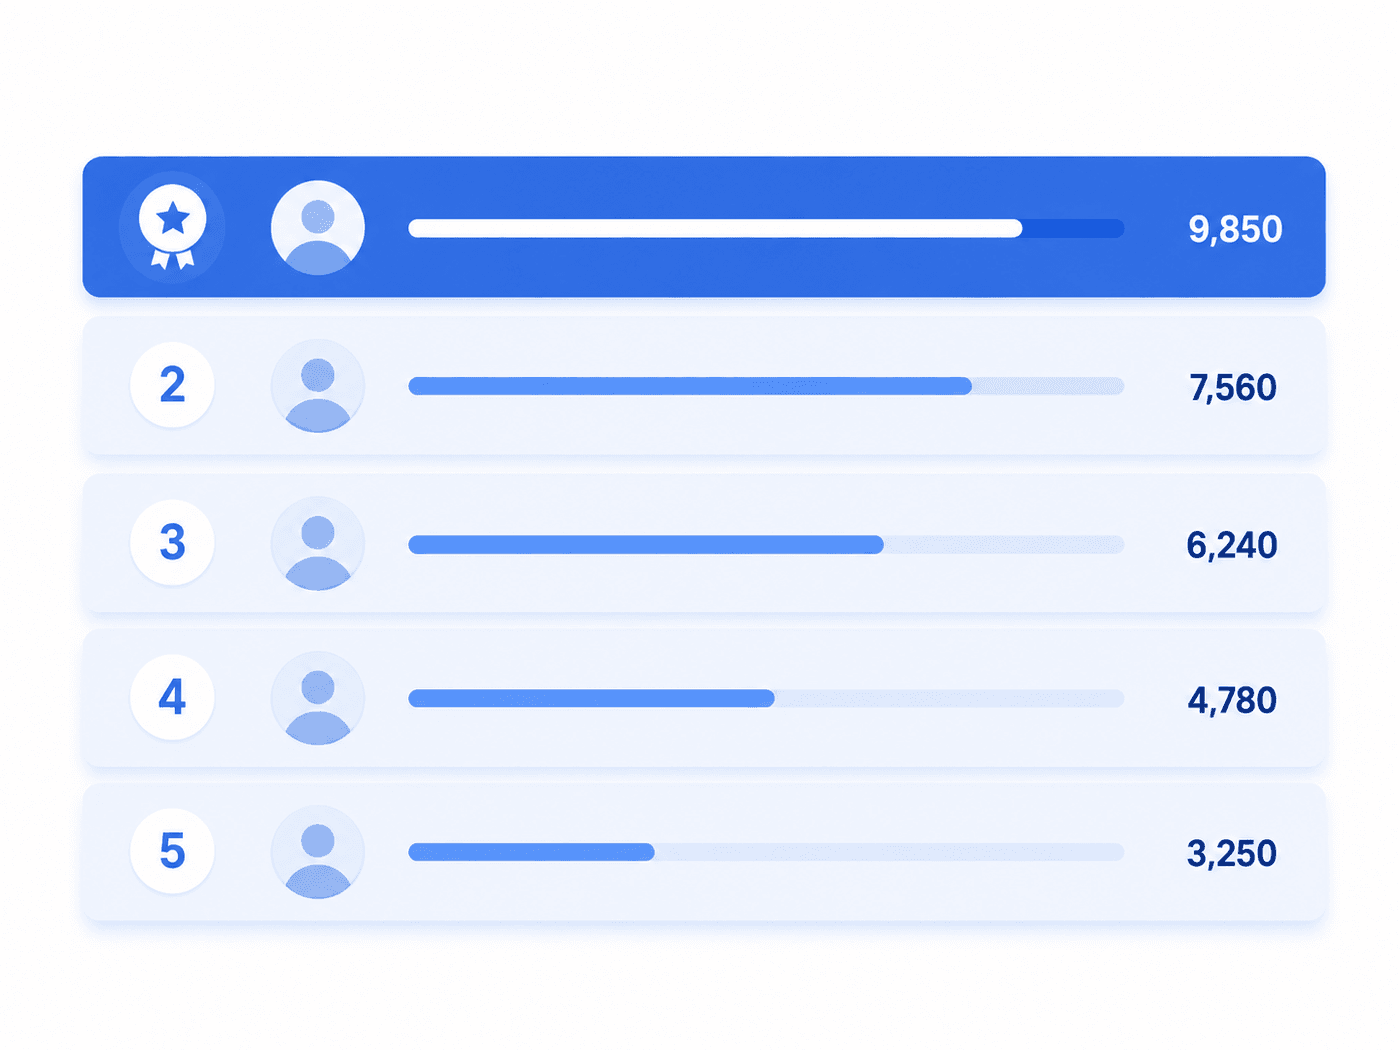
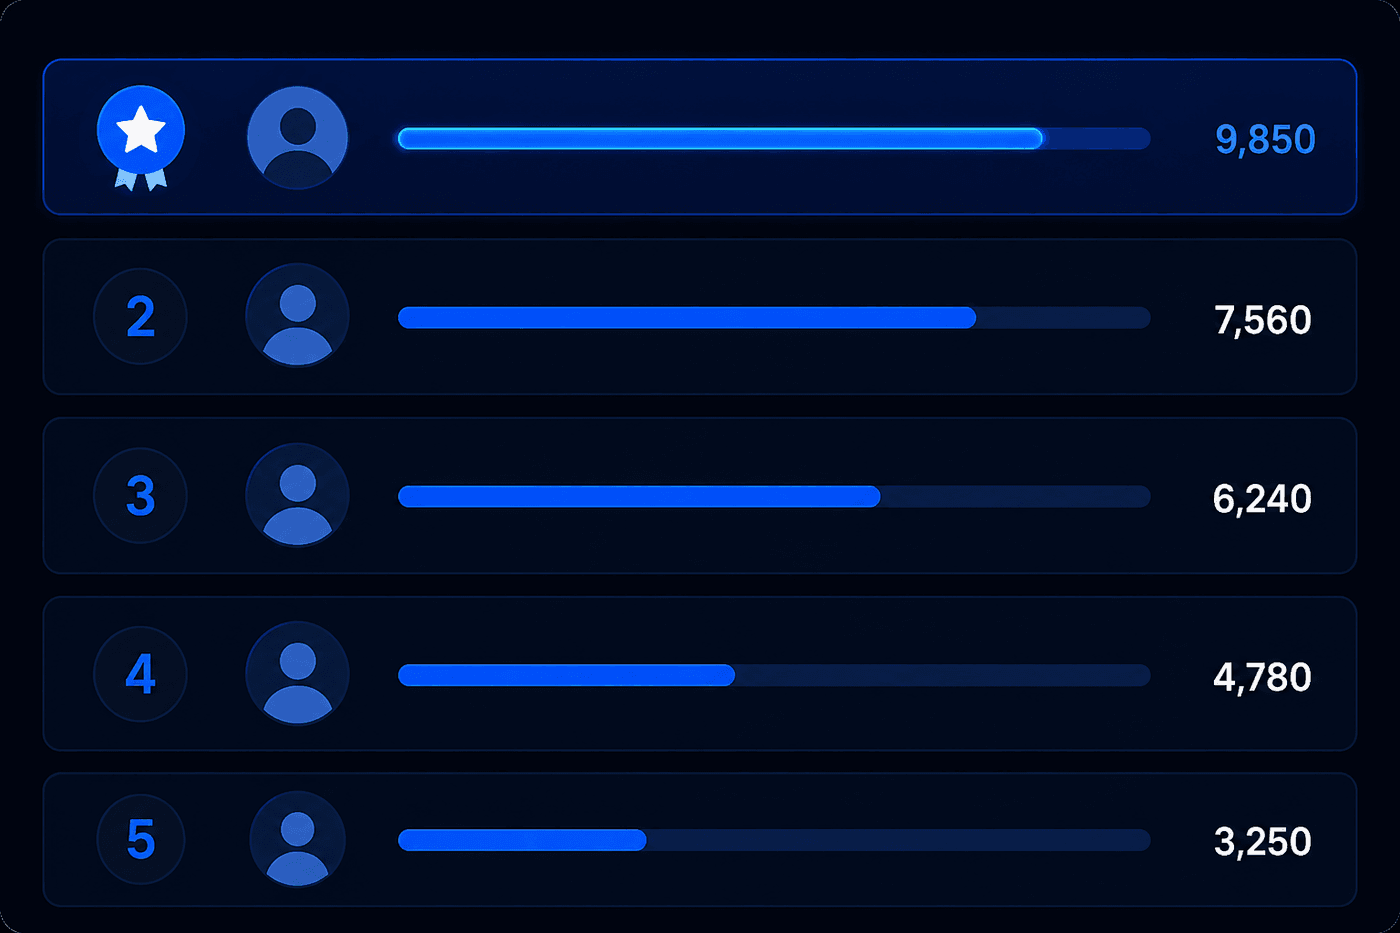
Ranked list sorted by any case metric.
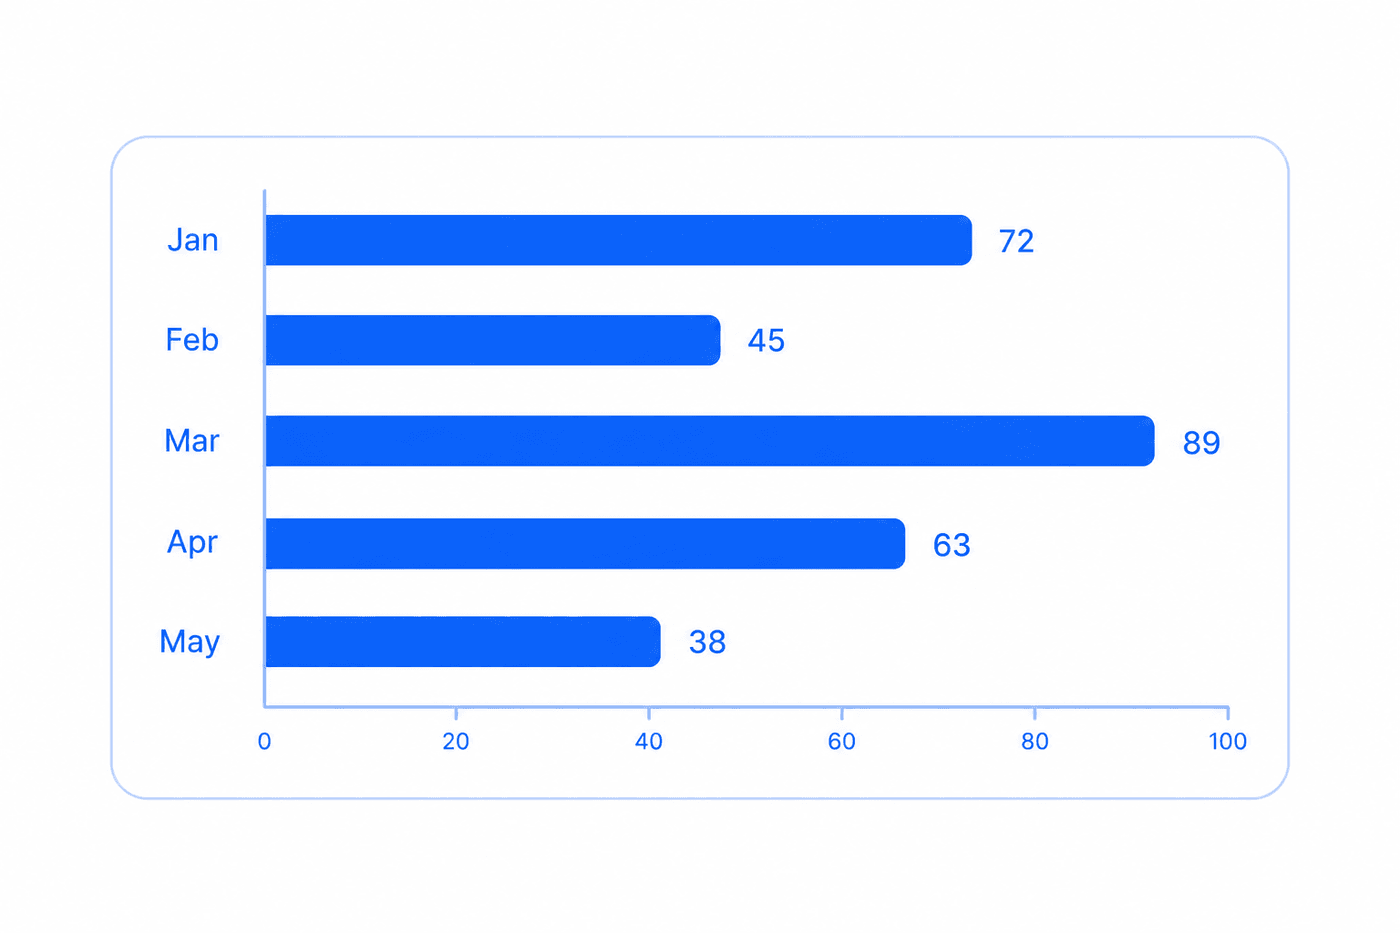
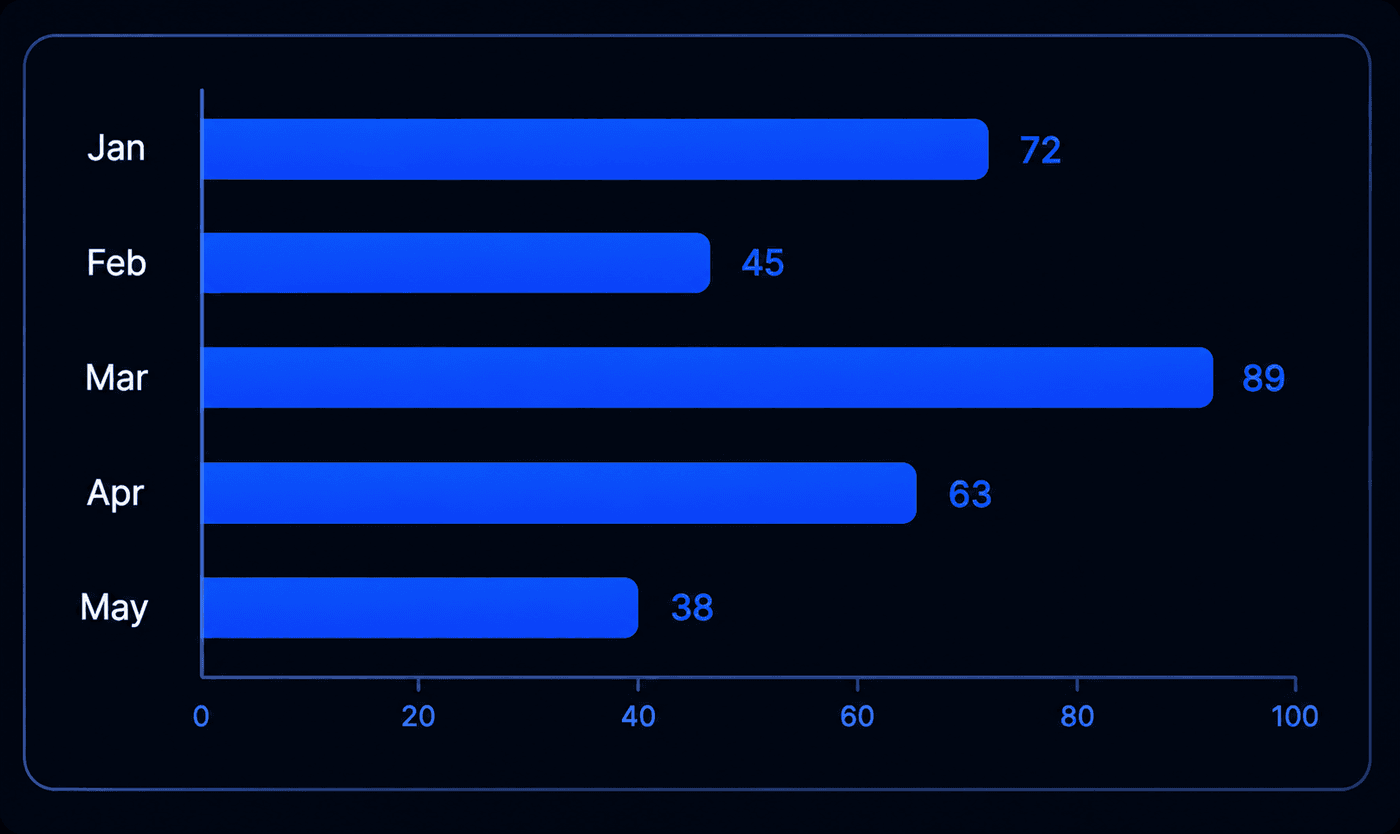
Ranked comparison across assignees or queues.
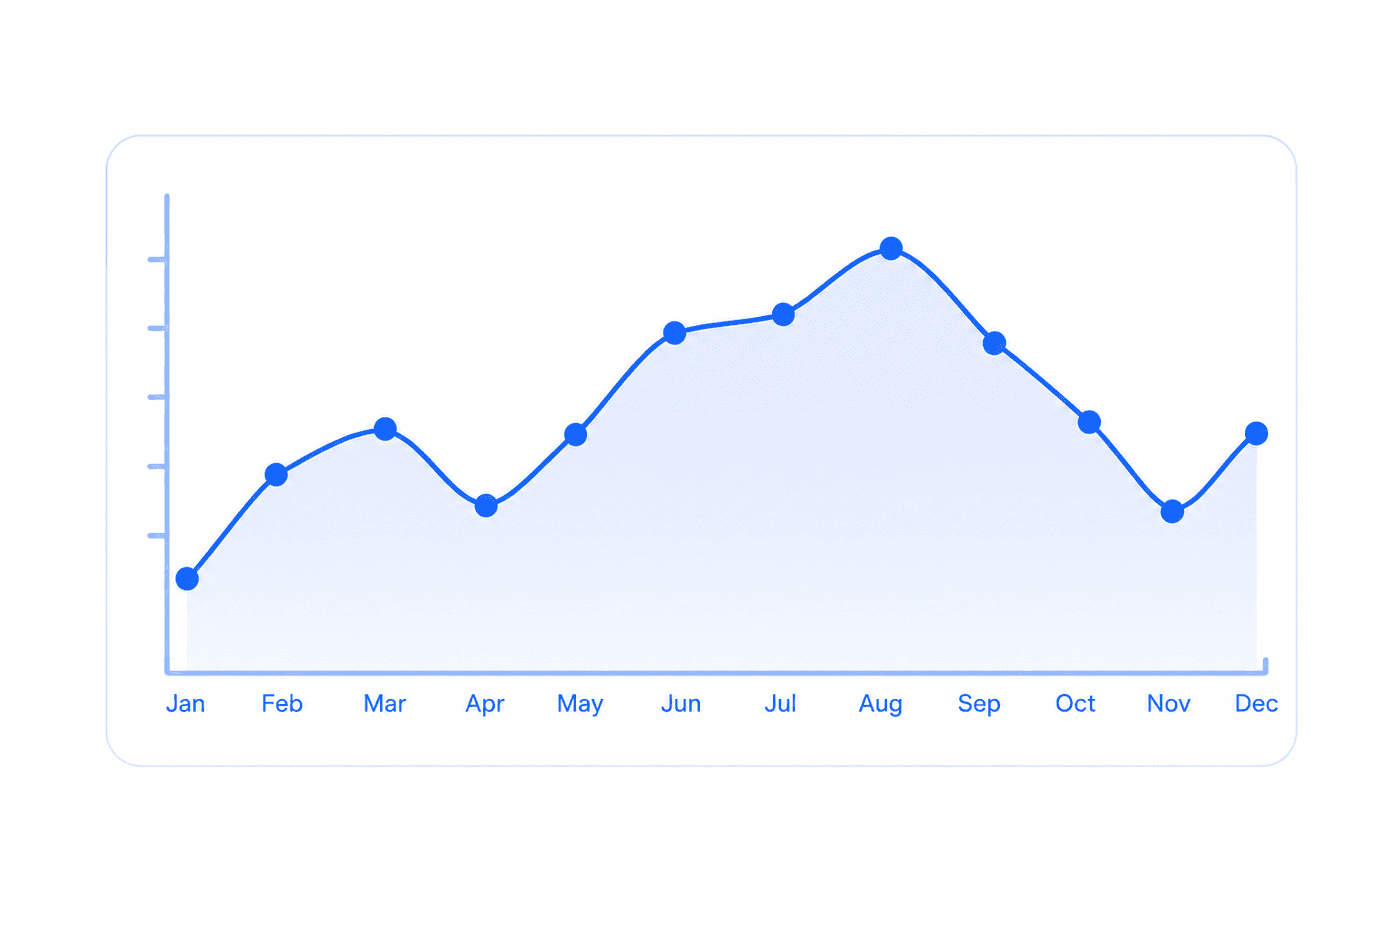
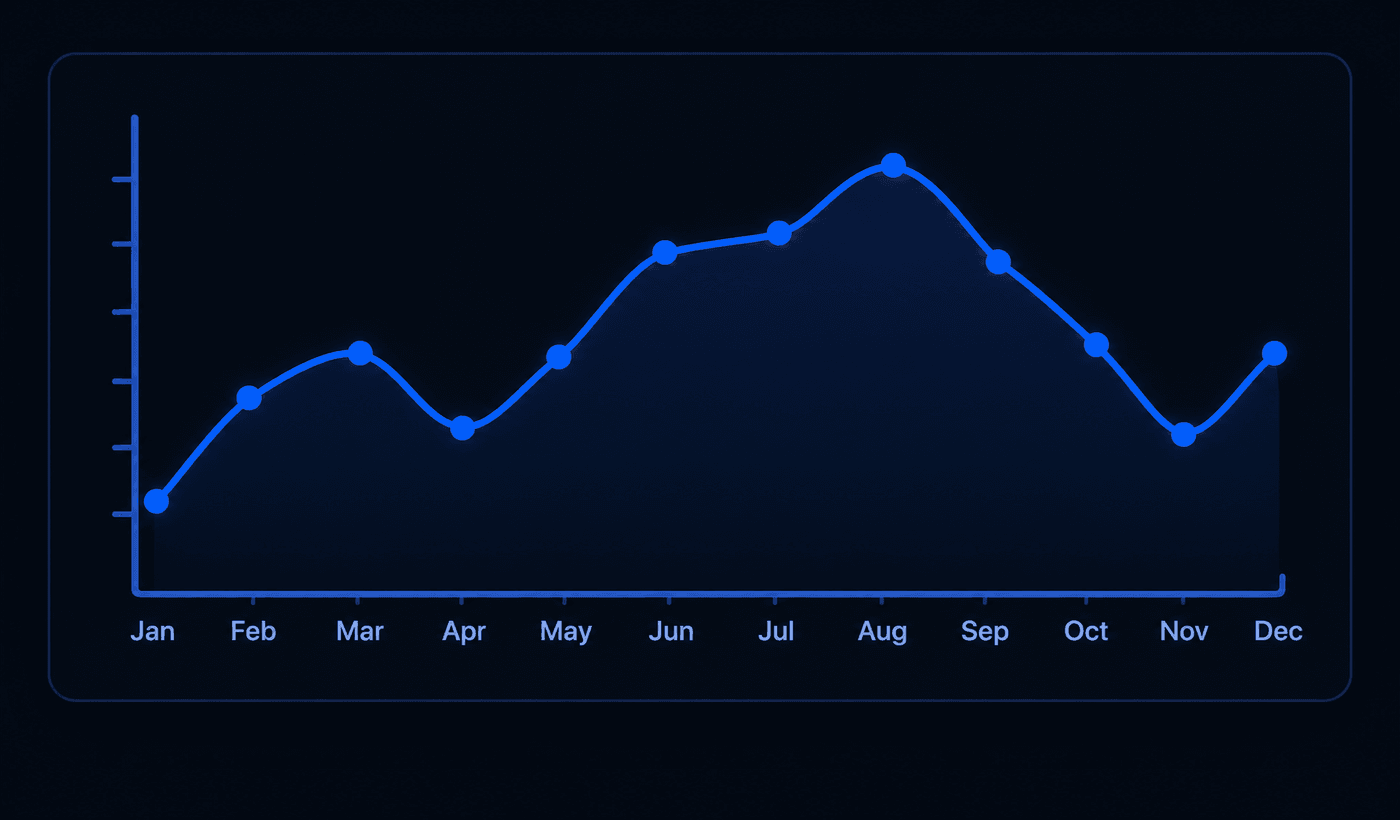
Case volume and resolution trends over time.
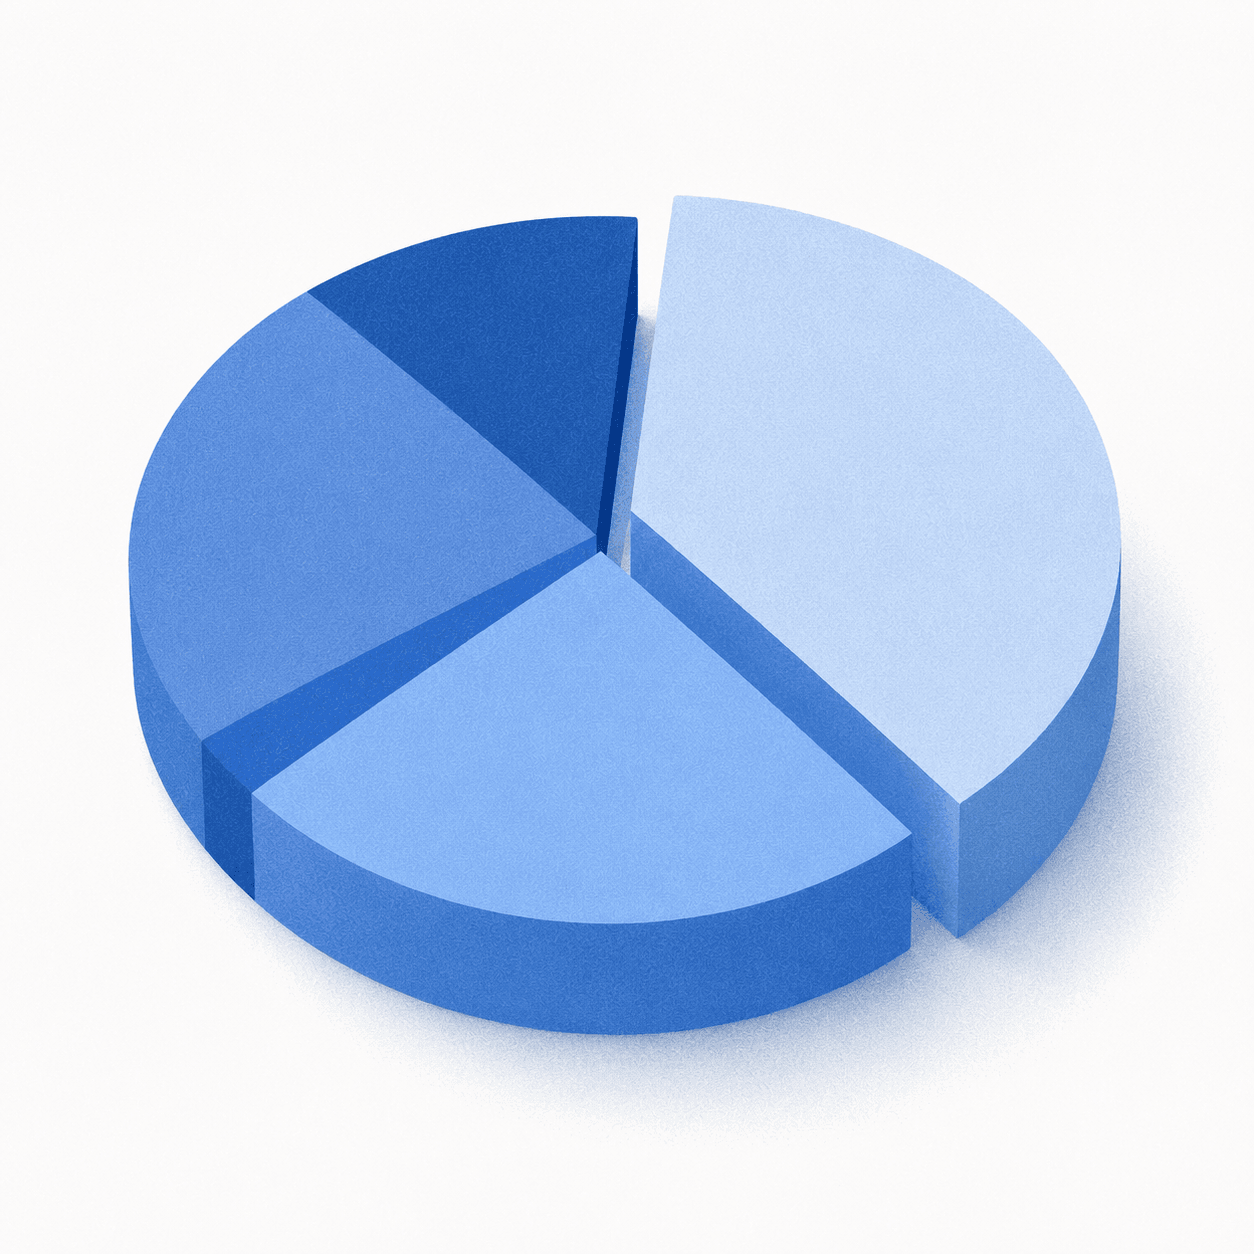
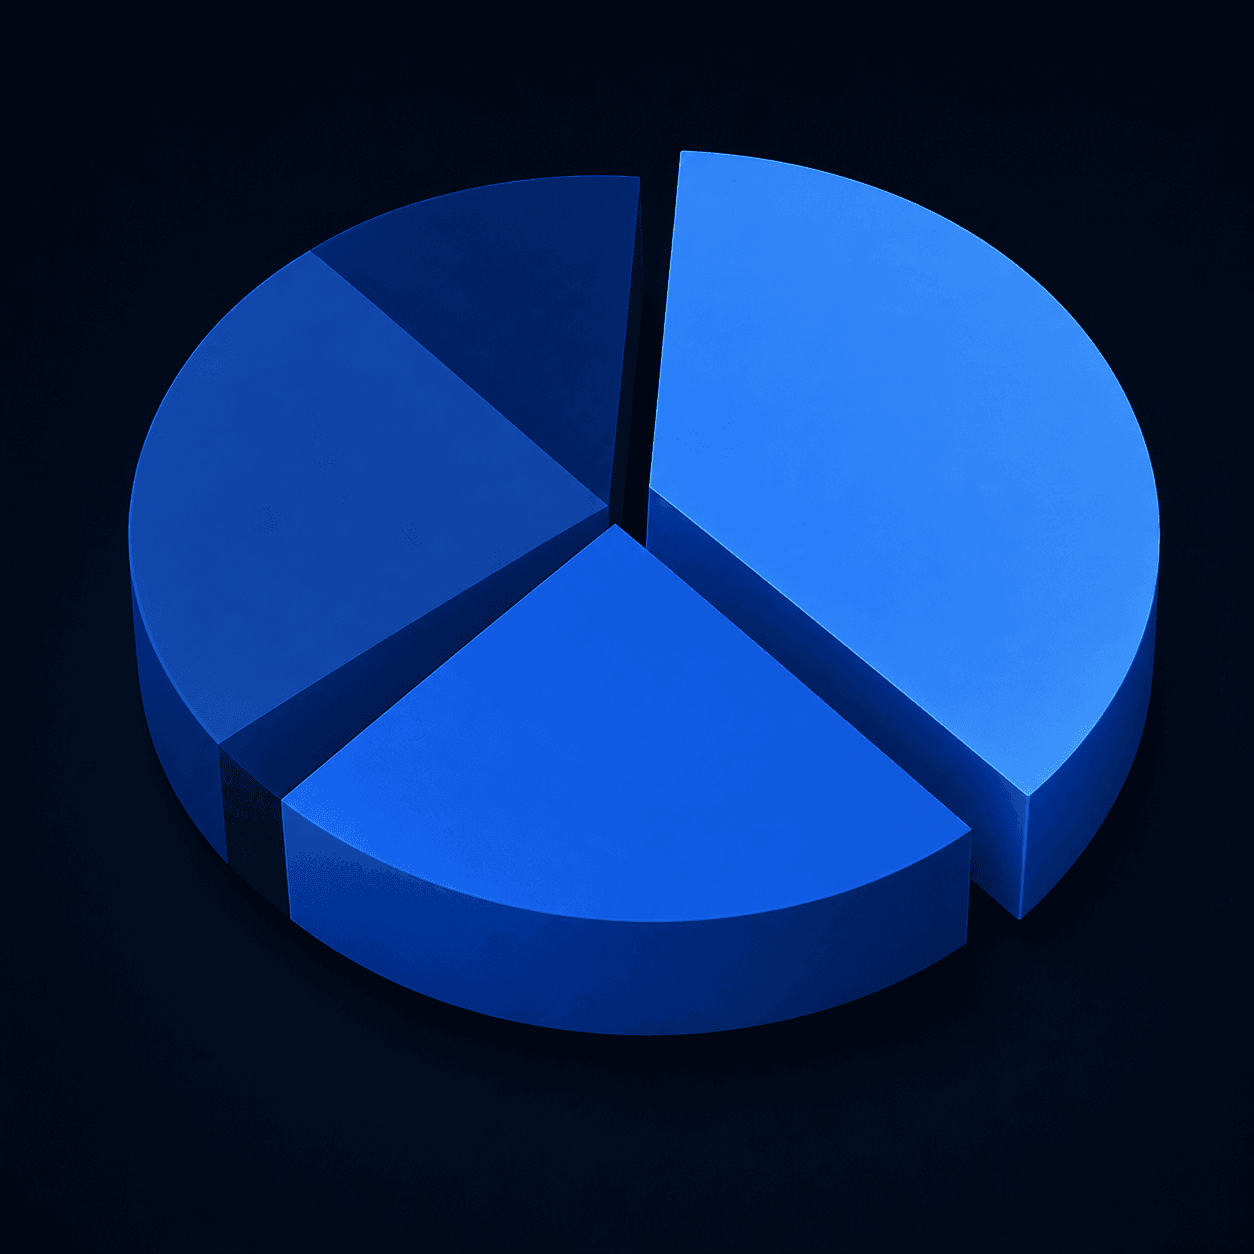
Distribution across statuses or priorities.
Start with a predefined dashboard or build from scratch. First scheduled report running before end of day.